Tableau
Business Analytics Anyone Can Use
Tableau Software helps people see and understand data. Used by more than 26,000customer accounts worldwide, Tableau’s award-winning software delivers fast analytics and rapid-fire business intelligence. Create visualizations and dashboards in minutes, then share in seconds. The result? You get answers from data quickly, with no programming required.
Do you know what all the fuss is about?
Here’s a comprehensive demo that will give you an idea why Gartner rates Tableau an outlier
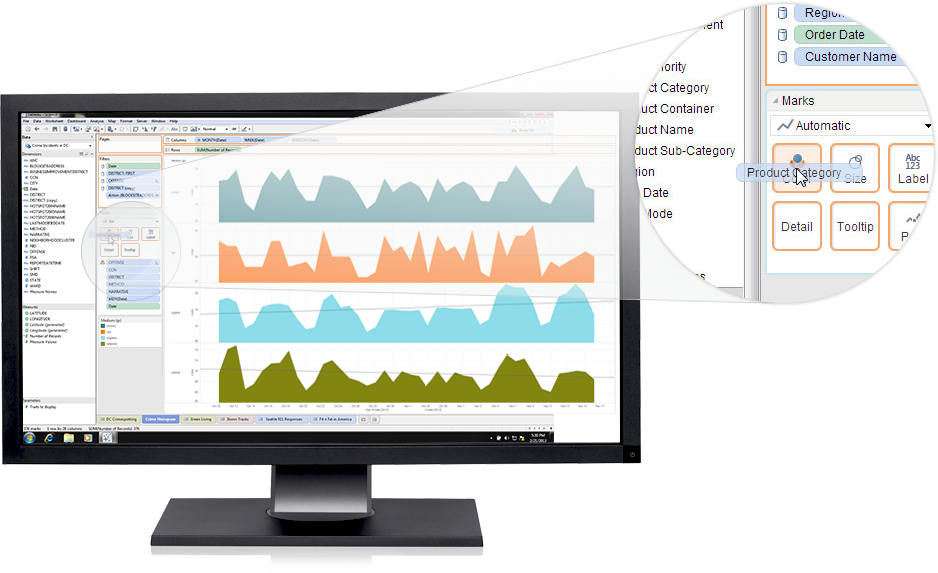
Answer questions as fast as you can think of them
Tableau Desktop is data analysis that keeps you in the flow. It’s easy to learn, easy to use, and 10-100x faster than existing solutions. It’s built on breakthrough technology that translates pictures of data into optimized database queries. Use your natural ability to see patterns, identify trends and discover visual insights in seconds. No wizards, no scripts, no programming.
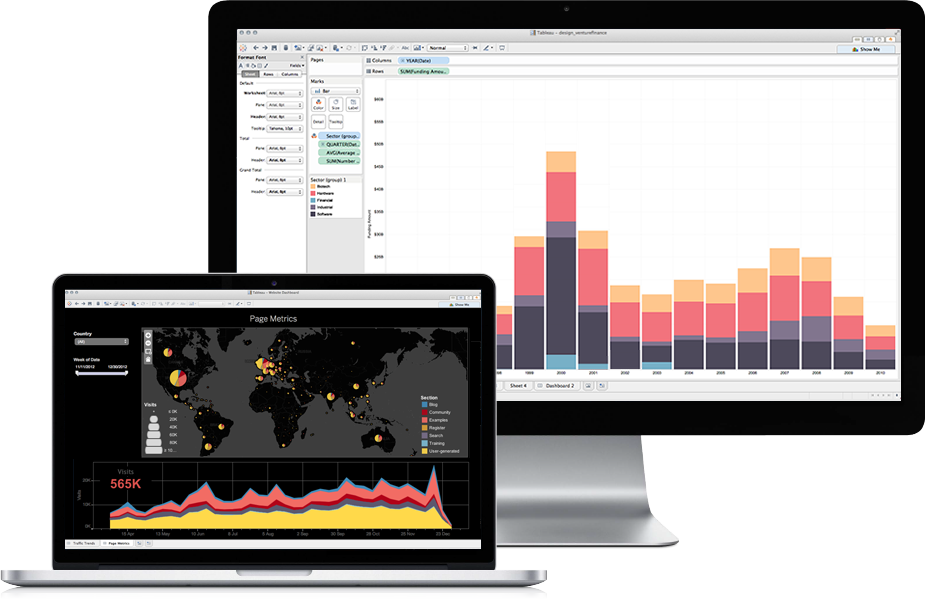
Discover insights at the speed of thought
Connect to your data and perform queries without writing a single line of code. Stay in the flow as you shift between views with drag-and-drop technology. Whether you measure your data in petabytes stored in the cloud or in billions of rows, Tableau is built to work as fast as you do. It’s self-service analytics, for everyone. Download a free trial and get more results with less effort.
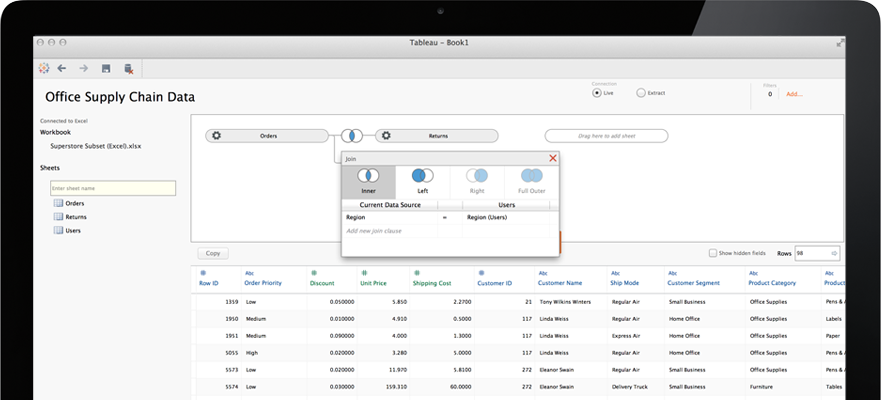
Get to your data, live or in-memory, in seconds
Connect directly to your data for live, up-to-date data analysis that taps into the power of your data warehouse. Or extract data into Tableau’s blazing fast data engine and take advantage of breakthrough in-memory architecture. Or do both, for 2, 3, or even 10 different data sources and blend them all together. It’s up to you and your data. See our list of native data connectors. Including sources like Google Analytics, Salesforce and of course, Microsoft Excel.
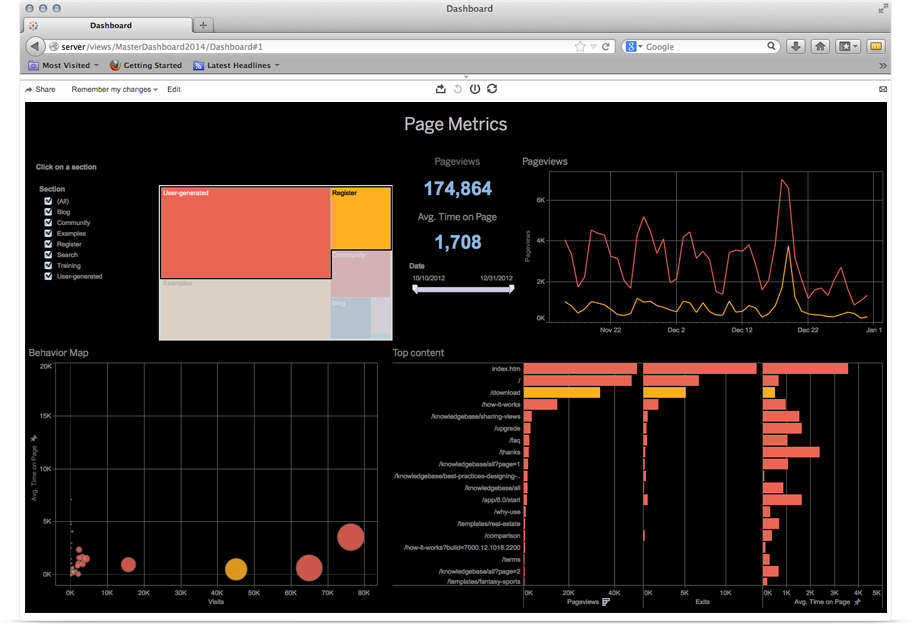
Share your insights with beautiful dashboards
Drive decisions using data. Combine multiple views into interactive dashboards. Highlight and filter data to show relationships. String together specific insights into a guided story to explain the ‘why’ behind your data. Share content using the web-based Tableau Server or Tableau Online. Build a data-driven culture. Download a free trial to start now.
Features that are intuitive and powerful
Drive decisions using data. Combine multiple views into interactive dashboards. Highlight and filter data to show relationships. String together specific insights into a guided story to explain the ‘why’ behind your data. Share content using the web-based Tableau Server or Tableau Online. Build a data-driven culture. Download a free trial to start now.
Pricing & Technical Specifications – Tableau Desktop
| Professional Edition | Personal Edition | |
|---|---|---|
| Price | US$1,999 per user | US$999 per user |
| File Sharing | Create package files for Tableau Reader Publish to Tableau Server or Tableau Online for web and mobile access |
Create package files for Tableau Reader |
| Data Connections | 40+ Tableau Server Data Sources Actian Vectorwise 2.0 or later (Windows only) Amazon Redshift Amazon Elastic MapReduce Cloudera Hadoop Hive and Impala; Hive CDH3u1, which includes Hive .71, or later; Impala 1.0 or later (incl. Kerberos support for Impala) DataStax Enterprise Edition 2.2 or later (Windows only) EXASOL 4.2 or later (Windows only) Firebird 2.1.4 or later Google Analytics Google BigQuery Google Cloud SQL Hortonworks Hadoop Hive 1.1 or later HP Vertica 6.x or later IBM BigInsights (Windows only) IBM DB2 9.1 or later for Linux, UNIX, or Windows (available on Tableau Desktop/Server on Windows only) IBM Netezza 4.6 or later (Windows only) MarkLogic (Windows only) MapR Distribution for Apache Hadoop 2.x or later (Windows only) Microsoft Access 2003 or later (Windows only) Microsoft Excel 2007 or later Microsoft PowerPivot 2008 or later (Windows only) Microsoft SQL Server 2005 or later (incl. support for Kerberos) Microsoft SQL Server Analysis Services 2005 or later, multi-dimensional mode only (Windows only)(incl. support for Kerberos) Microsoft SQL Server PDW V2 or later Microsoft Azure Marketplace DataMarket Microsoft Azure SQL Data Warehouse MySQL 5.0 or later OData Oracle Database 10.x or later Oracle Hyperion Essbase 11.1.1 or later (Windows only) ParAccel Analytics Database 3 or later (Windows only) Pivotal Greenplum 4.x or later PostgreSQL 8.3 or later Progress OpenEdge 10.2B patch 4 or later (Windows only) Salesforce.com, including Force.com and Database.com SAP HANA 1.0035 or later (Windows only) SAP NetWeaver Business Warehouse 7.00 with SP20+ recommended; also requires SAP GUI for Windows 7.20 or later client (Windows only) SAP Sybase ASE 15.5 or later (Windows only) SAP Sybase IQ 15 or later (Windows only) Spark SQL requires Apache Spark 1.2.1 or later Splunk Enterprise 6 or later (Windows only) Statistical Files; SAS (*.sas7bdat), SPSS (*.sav), and R (*.rdata, *.rda) Tableau Data Extract Teradata V2 R6.2 or later Teradata Aster Data nCluster 5.0 or later Teradata OLAP Connector 14.10 or later (Windows only) Text files — comma separated value (.csv) files Additional databases and applications that are ODBC 3.0 compliant |
6+ Microsoft Access 2003 or later (Windows only) Microsoft Excel 2007 or later Microsoft Windows Azure Marketplace DataMarket OData Tableau Data Extract Text files — comma separated value (.csv) files |
| System Requirements | Windows Microsoft Windows Vista SP2 or newer (32-bit and 64-bit) Microsoft Server 2008 R2 or newer (32-bit and 64-bit) Intel Pentium 4 or AMD Opteron processor or newer (SSE2 or newer required) 2 GB memory 750 megabytes minimum free disk space Internet Explorer 8 or newer Mac iMac/MacBook computers 2009 or newer OS X 10.9 or newer Virtual Environments Citrix environments, Microsoft Hyper-V, Parallels, and VMware All of Tableau’s products operate in virtualized environments when they are configured with the proper underlying Windows operating system and minimum hardware requirements. |
|
| Internationalisation | These products are Unicode-enabled and compatible with data stored in any language. The user interface and supporting documentation are in English, French, German, Spanish, Brazilian Portuguese, Japanese, Korean and Simplified Chinese. | |
